
Stop reacting to last month's numbers. Predict next month's.
We build forecasting, recommendation, scoring, and anomaly-detection models on your own historical data — validated against real outcomes, deployed behind an API your product can call, and monitored so accuracy doesn't quietly decay.
Four model families that cover most business problems
Almost every predictive request we get is one of these four underneath, whatever it's called internally.
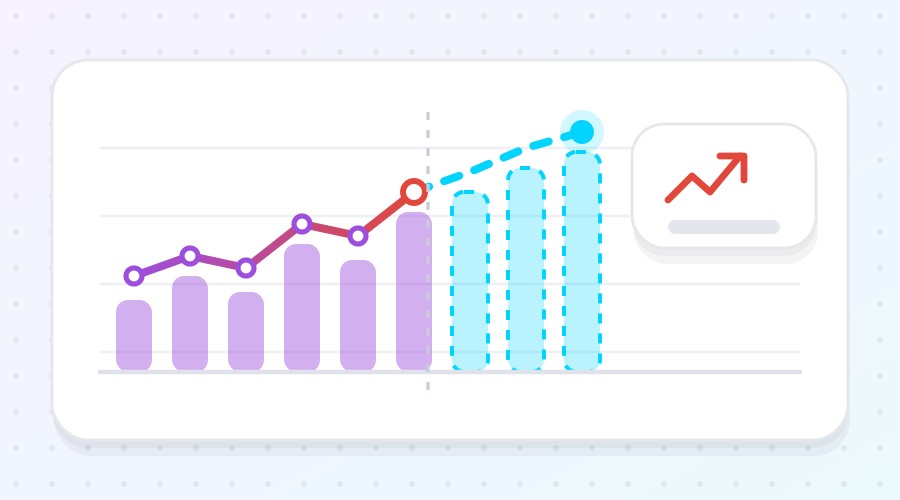
Forecasting Models
Project demand, revenue, headcount, inventory, or capacity weeks and months ahead — with confidence intervals, so your team plans around a range instead of a single optimistic number.

Recommendation Engines
Rank what each user should see next, based on what similar people did and what this person has already done. Works for products, content, courses, or the next best action for a sales rep.
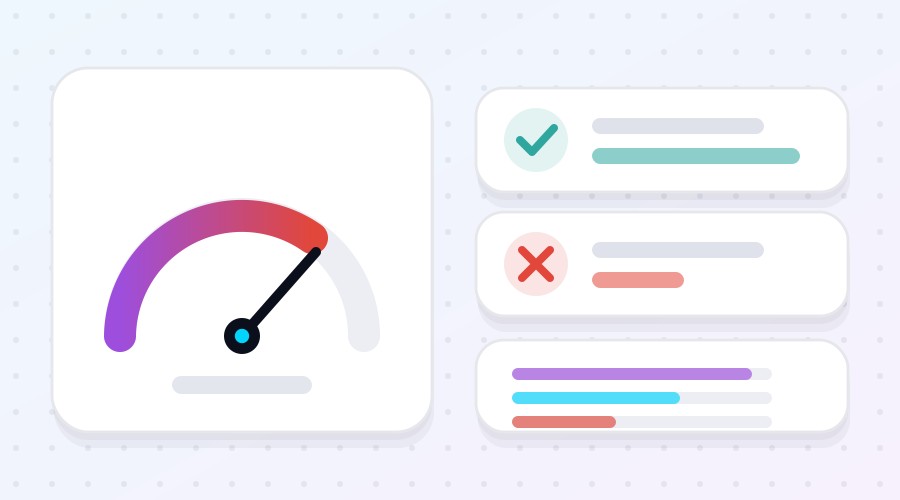
Classification & Scoring
Put a probability on an outcome and act on it: which leads will convert, which customers are about to churn, which applications carry risk. Every score comes with the factors that drove it.
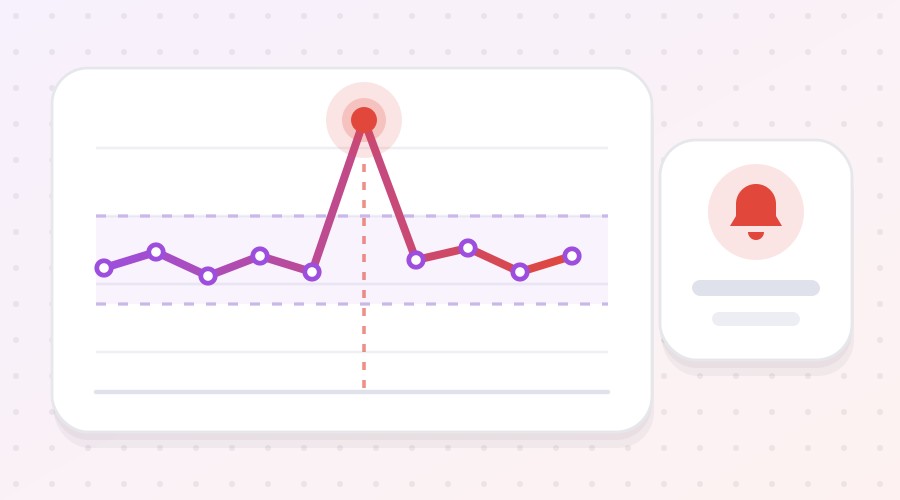
Anomaly & Failure Detection
Learn what normal looks like across transactions, logs, or sensor streams, then flag the readings that don't fit — before a fraud loss lands or a machine stops mid-shift.
Predictive models by business function
The same four model families, pointed at the decisions each team makes every week.
Sales & Marketing
Score leads by conversion likelihood, forecast the quarter from pipeline behaviour, and predict which accounts are drifting before renewal.
Supply Chain
Demand forecasts at SKU and location level, lead-time prediction, and reorder points that respond to actual volatility instead of a fixed buffer.
Finance & Risk
Credit and underwriting scores, cash-flow projection, fraud and duplicate-payment detection, and early warning on receivables.
Manufacturing
Failure prediction from sensor telemetry, defect classification from line imagery, yield forecasting, and downtime risk by shift.
Retail & E-commerce
Personalized product ranking, price elasticity modelling, basket and lifetime-value prediction, and return-risk scoring at checkout.
People & Operations
Attrition risk by team, staffing and shift demand forecasting, ticket-volume prediction, and SLA breach warnings before they happen.
The stack behind our ML builds
From question to model in production
Five stages, each ending in something you can review — starting with an honest read on whether the data supports the question.
Feasibility
We inspect your data, define the target variable, and say plainly whether it's predictable.
Baseline
A simple model first, so every later gain is measured against something real.
Modelling
Feature work and several model families, compared on the same held-out period.
Validation
Backtesting, error analysis, and a business-metric read before anything ships.
Deploy & retrain
Endpoint or batch job, drift monitoring, and a scheduled retraining loop.
Have a number you'd like to see before it happens?
Send us the question and a sense of what data sits behind it. We'll come back with whether it's predictable, which model family fits, and what accuracy is realistic — before you commit to a build.
Start a Project →Questions teams ask us before starting
Don't see your question here? Send it over and we'll answer it directly.
It depends more on the shape of the data than the volume. Forecasting usually wants two to three years of history so seasonality is visible. Classification often works from a few thousand labelled examples, as long as both outcomes are well represented. The feasibility stage answers this for your specific case in about a week.
Generative models produce content; predictive models produce a number or a probability. For "how many units will we sell in March" or "is this transaction fraudulent", a well-tuned tabular model is usually cheaper, faster, and more accurate than an LLM — and its output can be tested against what actually happened.
Yes. We ship feature-importance and per-prediction attributions with every scoring model, so you can show which factors drove an individual result. Where regulation demands full transparency, we'll favour an inherently interpretable model even at a small accuracy cost.
Anyone who quotes a number before seeing your data is guessing. The useful benchmark isn't a percentage — it's whether the model beats how you decide today. We measure both, and report the gap in business terms like forecast error or false positives per week.